
Page 9 - Norris Electric News April 2022
P. 9
2021 FINANCIAL REPORT 9
NORRIS PUBLIC POWER DISTRICT
December 31, 2021 and 2020
Statements of Revenues, Expenses and Changes in Net Position
Statements of Net Position
2021
Rural residential
Towns and villages
Irrigation 8,105,862
2020
$20,150,015 8,527,459 6,336,261 8,269,232
31,121,088
278,411 1,112,325 4,614,807
(8,270) 849,633 81,250,961
57,388,588 7,791,417
4,122,290
6,773,297
76,075,592
5,175,369 886,943 $6,062,312
Assets
Net capital assets Cash and investments Accounts receivable Other assets
Total Assets
Liabilities and Net Position
Total net position
Total long-term debt
Other long-term liabilities
Current liabilities
Deferred gain on sale of a portion of service territory
Total Liabilities and Net Position
2021
$153,460,707 36,975,836 7,221,259 10,398,129 $208,055,931
$188,854,615 -
7,883,035 9,717,458
1,600,823
$208,055,931
2020
$148,678,825 45,546,822 7,600,380 8,711,376 $210,537,403
$180,247,199 6,226,151 6,887,621 15,383,511
1,792,921
$210,537,403
2020
24,663 6,214 1,012,425,469 $0.0794 1,056,850,579 $0.0543 202 MW August 58.66% $8,839,148
Operating Revenue
$19,886,186 7,997,265
Small commercial
Large commercial and industrial
Public street lighting
Annual services
Sales for resale
Unbilled revenue adjustment Other revenues
Total Operating Revenue
Operating Expenses
Cost of power
Operations and maintenance
Administrative, customer and general
8,271,002 31,084,913
261,516 1,124,775 4,704,511
(80,623)
897,241
82,252,648
56,874,289 6,837,984
System Statistics
3,902,252 Depreciation 6,980,520
Total Services
Miles of Line
TotalkWhSold
Average Revenue per kWh Sold TotalkWhPurchased
Average Power Cost per kWh System Peak Demand
Month of Peak Demand Annual Actual Load Factor Capital Expenditures
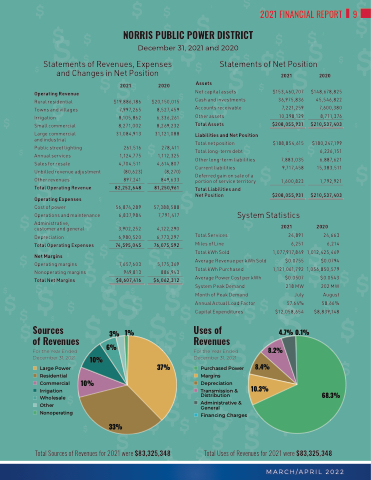
Uses of Revenues
For the Year Ended December 31, 2021
2021
24,891 6,251 1,077,917,849 $0.0755 1,121,061,792 $0.0507 218 MW July 57.64% $12,058,654
Total Operating Expenses
Net Margins
Operating margins Nonoperating margins Total Net Margins
Sources
of Revenues
For the Year Ended December 31, 2021
d Large Power d Residential d Commercial d Irrigation
d Wholesale
d Other
d Nonoperating
74,595,045
7,657,603 949,813 $8,607,416
3% 1% 6%
4.7% 0.1% 8.2%
10% 10%
37%
d Purchased Power 8.4% d Margins
10.3%
d Depreciation d Transmission &
68.3%
Distribution
d Administrative & General
d Financing Charges
Total Sources of Revenues for 2021 were $83,325,348
Total Uses of Revenues for 2021 were $83,325,348
33%
MARCH/APRIL 2022
